India’s Macro Outlook 2025–26
India leads global growth in 2025–26, but oil, the rupee, and export headwinds could quickly narrow the margin of safety.
Akanksha
·October 4, 2025

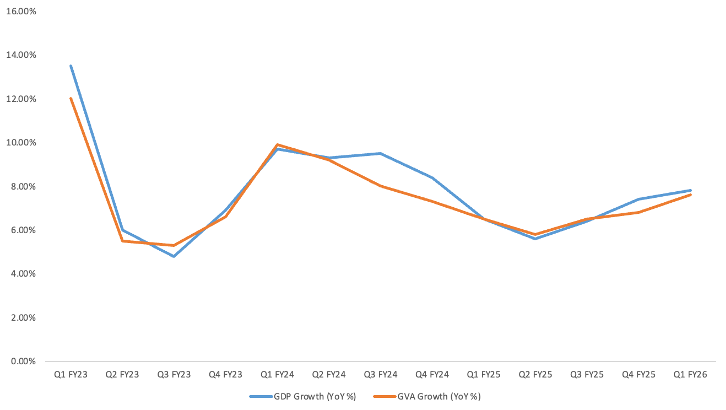
India continues to be the fastest-growing large economy in the world. In the first quarter of FY26, GDP grew by 7.8% YoY, a five-quarter high and far above the RBI’s 6.5% projection. This momentum is followed by a 7.4% in Q4 FY25, implying that India’s growth is not just a short-lived cycle, but part of a broader, more durable trend.
Unlike East Asia’s export-led model, India’s growth is domestic-first, driven by a strong household demand. The key risk remains external balances: oil imports, capital flows, tariff shifts and global uncertainty. Let’s dive deep into how India’s growth machine actually works, what can break it, and where the opportunities are.
We structure our outlook around three themes:
Theme 1: India’s Growth Engine - How India’s current economy is driven by consumption, capex, and exports.
Theme 2: Fiscal and Policy Room - Why India’s fiscal position looks stable, but space for shocks is limited.
Theme 3: Stress Tests and Risks - Where shocks can derail the story and what signals to watch. Where the numbers sit right now?
Theme 1: India’s Growth Engine
Demand: Consumption at the Core
Real GDP grew by 7.8% in Q1 of FY26 GDP, while the nominal grew by 8.8%. GVA grew by 7.6%, majorly led by services, manufacturing, and construction. Net indirect taxes increased by 12.7% in Q4 FY25. This created a positive increase from GVA to GDP after three quarters.
Private Consumption Expenditure accounts for approx. 60% of GDP, higher than China’s 38%, and comparable to Indonesia, which is at 55%. Consumption led economy makes growth sensitive to income and inflation.
Investment: Capex Momentum
Gross Fixed Capital Formation (GFCF) makes up almost 30% of GDP. In Q4 of FY25, investment growth surged to a six-quarter high of 9.4%, which was led by infrastructure and housing. Public capex is beginning to catalyse private sector participation, suggesting that the government’s investment push is crowding in private spending.
Exports: Net Contribution Surprises
Net exports added 3.7 percentage points to GDP in Q4 FY25, as exports grew by 3.9% ,and imports contracted by 12.7%. Services exports remain resilient despite US/Europe tech headwinds. Goods exports face tariff headwinds, but EU FTA and China rebalancing could reshape partners.
Theme 2: Fiscal and Policy Room
India’s Fiscal Position Looks Sustainable
India’s central fiscal position looks stable for now. The government is sticking to its plan to slowly reduce the deficit to 4.4%. The Union government does have some cyclical room to respond to a shock, but the space is not huge unless growth, and revenues stay strong.
Fiscal deficit fell from 5.6% (FY24) to 4.8% (FY25), and now the current estimate for FY26 is 4.4%. Revenue deficit estimate is 1.5% , 40bps down from 1.9% seen in FY25. Primary deficit estimate is 0.8% for FY26. Effective revenue deficit shrinks to 0.3% in FY26 Estimates.
Financing is overwhelmingly domestic, which lowers FX-risk, unlike some EMs such as Turkey or Argentina, who borrow heavily in USD. So, even if global conditions tighten, India doesn’t face an immediate “currency crisis risk” from its central borrowing.
What that means for sustainability (vs EM peers)
A primary deficit near 0.8% of GDP is small. If nominal GDP growth, 10-11% at the moment, runs comfortably above the effective interest rate on government debt (which has generally been true for India in recent years), which is 6.5-7% , then the debt ratio tends to stabilize/fall even with a small primary deficit.
FX vulnerability is low because new financing is mostly in rupees. Many EM peers rely more on FX debt and are far more exposed to USD cycles; India’s composition is a relative strength.
The path to 4.4% fiscal deficit signals policy commitment. Many large EM sovereigns still sit near or above 5–6% central deficits; trending lower, while keeping capex high, puts India mid-to-better in the peer group from a central stance.
Do we have room to spend in a shock?
Some space, not unlimited. With the primary gap 0.8%, the government can afford to let the deficit temporarily widen by 0.5–1% of GDP in case of a shock. This wouldn’t destabilise debt, as long as growth momentum holds and interest rates don’t overshoot. That’s the core debt-dynamics test many EMs fail. This widening can come from: automatic stabilisers (lower revenues, higher welfare spend when growth dips), or targeted measures (rural stimulus, tax rebates).
But constraints remain. The figures here are Union only; adding states keeps the general government deficit materially higher than 4.4%. That narrows consolidated space. If growth slows or inflation/interest costs pick up, the nominal GDP growth vs effective interest rate on government debt cushion shrinks quickly. Maintaining the fiscal deficit lowering path would require reducing capex, trim revenue outlays, rather than big fresh stimulus.
Inflation & Monetary Policy
Headline CPI is 2.07% YoY (up from 1.61% in July, still very low). Food inflation reduced by 0.69% YoY due to stable harvests and supply conditions. Repo rate stands at 5.50% as RBI cut 50 bps. FX reserves are at $689 bn. CAD narrowed to 0.6% of GDP in FY25, cushioned by services surplus and remittances.
Foreign exchange reserves is $688.9 billion which is sufficient to cover 10-11 months of merchandise imports.
Headline inflation is very low (2.07 %). That gives RBI a lot of “headspace” to ease policy if growth is weak. The RBI currently has room to be supportive or neutral depending on growth data, it doesn’t need to be very tight.
Theme 3: Stress Tests and Risks
Scenarios
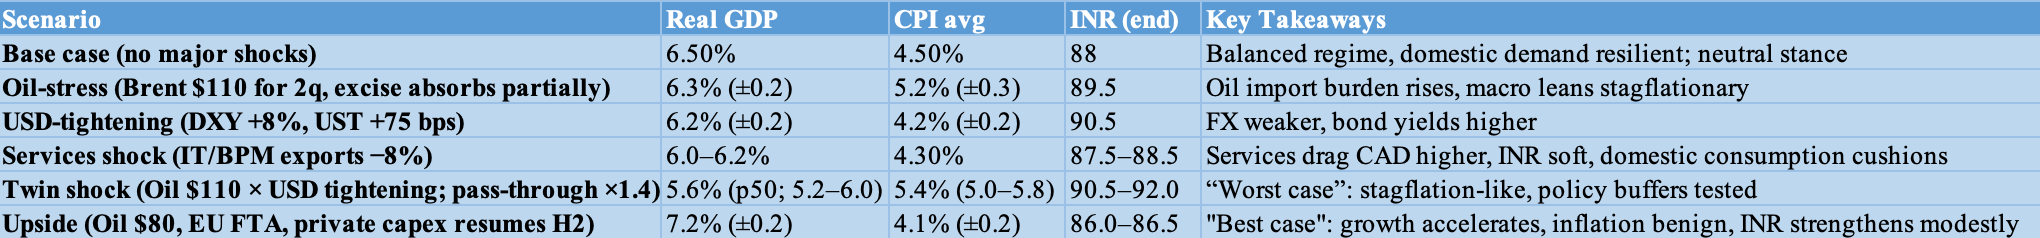
We are stress-testing India’s GDP, CPI, and INR, over the next 12 months. For each scenario, we report the median expected value, and where possible, we also give a confidence band to show uncertainty.
Driver attribution
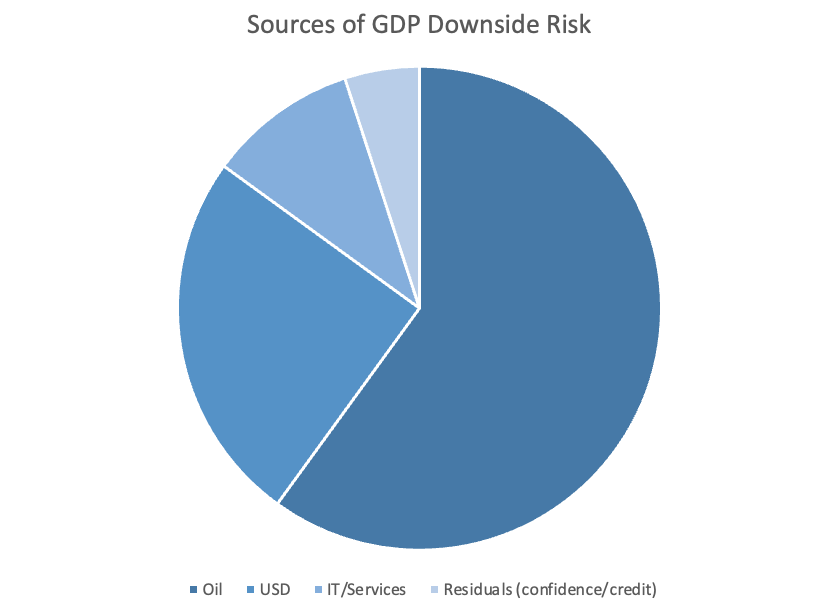
The primary source of risk to GDP is global commodity prices and financial conditions.
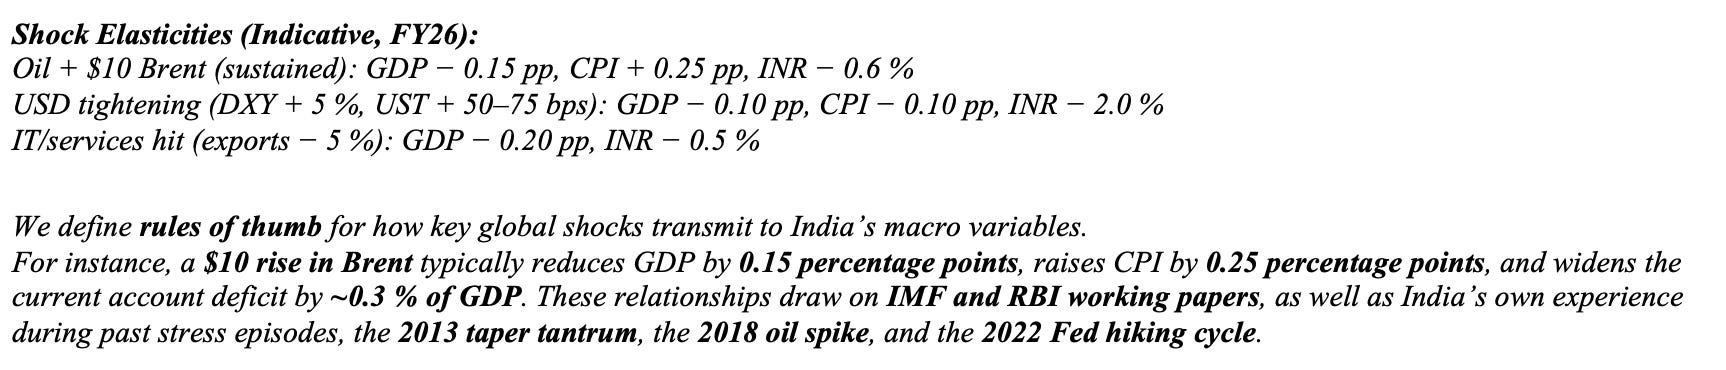
Oil Shock: Accounts for approx. 60% of the potential GDP shortfall. A sustained
$10 rise in Brent crude is a key source of stagflation risk, increasing the import bill, raising CPI, and forcing a potentially tighter RBI stance.
USD Tightening: Accounts for approx. 25% of the shortfall. A strengthening dollar (DXY +5%, UST +50–75 bps) pressures financial conditions, weakens the INR, and raises bond yields.
Services Shock: Accounts for approx. 10% of the shortfall. Weakening IT/BPM exports hit the services surplus and put minor pressure on the INR.
Policy Reaction Function (Indicative Responses)
Oil Stress: Government can cut excise/VAT (reducing CPI pass-through by 30–40%). RBI likely tolerates temporary headline inflation overshoot if core inflation remains anchored.
USD Tightening: RBI prioritises INR stability over growth if volatility spikes. Liquidity tools (VRRR/LAF) absorb excess liquidity.
Services Shock: Impact cushioned by India’s offshoring mix and diversification toward EU/APAC markets. Fiscal response muted unless employment data weaken materially.
In periods of stress, a flight to quality will occur.
Oil-Stress: Firms with pricing power and sectors with natural USD hedges tend to fare better.
USD-Tightening: Domestically oriented activity has historically been more resilient than FX-sensitive segments.
Twin Shock (Oil + USD Tightening): History suggests defensive balance sheets, USD-linked exposures, and short-duration debt instruments offer more stability as external balances deteriorate faster.
Peer Comparison
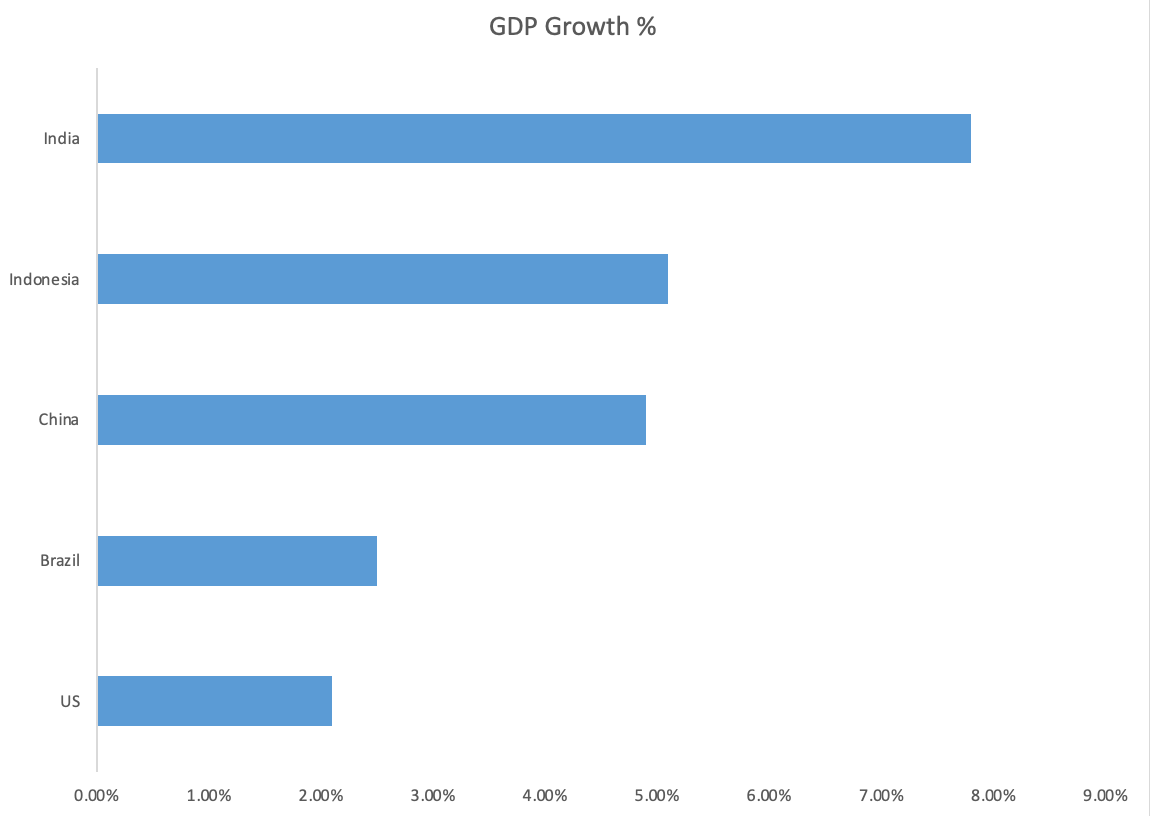
India’s growth is the fastest among the G20. China posted 4.9% growth constrained by property-sector stress. Indonesia expanded by 5.1%, supported by commodities. Brazil managed to just 2.5%, as the commodity upcycle fades. United States slowed to 2.1%, capped by tight policy settings.
India stands out as the only large economy consistently above 6%.
Disclaimer
This publication is for informational and analytical purposes only and does not constitute investment advice, research, or a recommendation to buy or sell any financial instruments. The views expressed are based on publicly available data and historical patterns, including IMF and RBI sources, and may change without notice.